---
title: "Analyses des résultats électoraux de la circonscription 92-13"
author:
- name: Cédric Midoux
orcid: 0000-0002-7964-0929
affiliations:
- name: BLR
country: FRANCE
date: last-modified
date-format: iso
license: CC BY-SA
---
## Import data
```{r}
#| label: data
library(tidyverse)
palette_nuances <- c(
    "LEXD" = "black",
    "LDVD" = "royalblue2",
    "LUD" = "royalblue4",
    "LUDI" = "deepskyblue3",
    "LDVC" = "steelblue",
    "LREM" = "orange",
    "LDIV" = "goldenrod2",
    "LDVG" = "orchid",
    "LUG" = "deeppink3",
    "LVEC" = "darkgreen",
    "LFI" = "firebrick2"
)

communes9213 <- c(
    "92002" = "Antony",
    "92014" = "Bourg-la-Reine",
    "92019" = "Châtenay-Malabry",
    "92071" = "Sceaux"
)

url_sig <- "https://www.data.gouv.fr/api/1/datasets/r/f98165a7-7c37-4705-a181-bcfc943edc73"

sig9213 <- sf::st_read(url_sig) |>
    filter(codeDepartement == "92", codeCommune %in% names(communes9213))
df <- arrow::read_parquet(
    "https://opendata.hauts-de-seine.fr/api/explore/v2.1/catalog/datasets/resultats-des-elections-par-bureau-de-vote/exports/parquet?lang=fr&timezone=Europe%2FBerlin",
    col_select = c(
        "election",
        "type",
        "annee",
        "tour",
        "code_circonscription",
        "circonscription",
        "commune",
        "code_insee",
        "code_bureau_vote",
        "inscrits",
        "abstentions",
        "votants",
        "blancs_et_nuls",
        "blancs",
        "nuls",
        "exprimes",
        "num_panneau",
        "candidat_ou_liste",
        "sexe",
        "nom",
        "prenom",
        "voix",
        "code_canton",
        "canton",
        "code_nuance",
        "candidat_ou_liste_nuance",
        "nom_source",
        "prenom_source",
        "code_sigle"
    )
) |>
    mutate(
        across(
            c(
                election,
                type,
                commune,
                code_insee,
                code_bureau_vote,
                candidat_ou_liste,
                code_nuance
            ),
            as_factor
        ),
        annee = as_factor(year(annee))
    )

df_2026 <- df |>
    filter(
        election == "Municipales 2026 - 1er tour",
        code_insee %in% names(communes9213)
    ) |>
    select(
        commune,
        code_insee,
        code_bureau_vote,
        inscrits,
        exprimes,
        voix,
        nom,
        code_nuance
    ) |>
    mutate(
        code_nuance = factor(
            code_nuance,
            levels = names(palette_nuances)
        ),
    )

df_2026 |>
    select(commune, nom, code_nuance) |>
    distinct() |>
    knitr::kable()
```
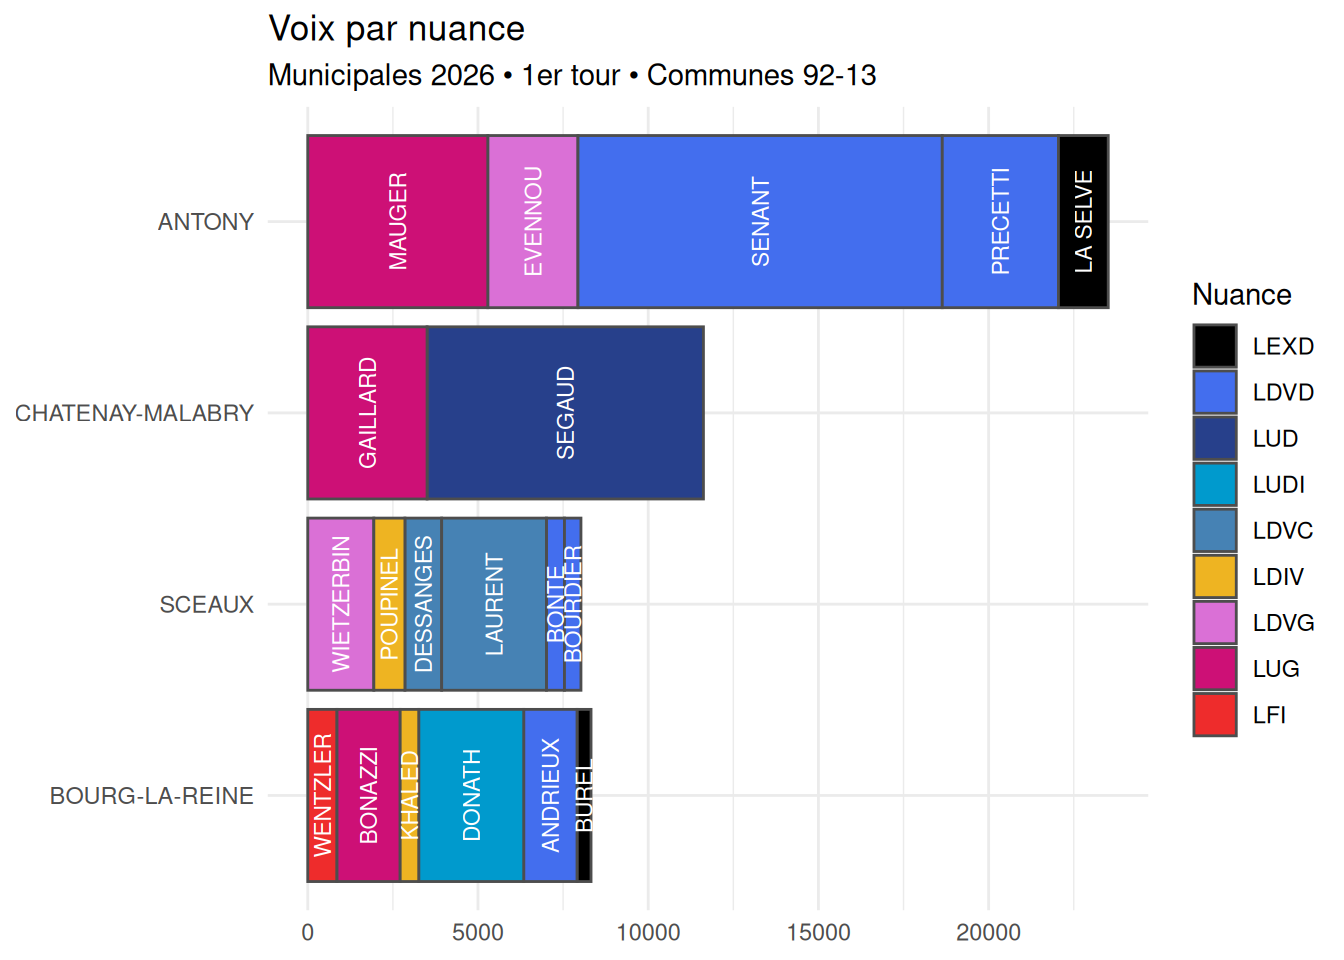
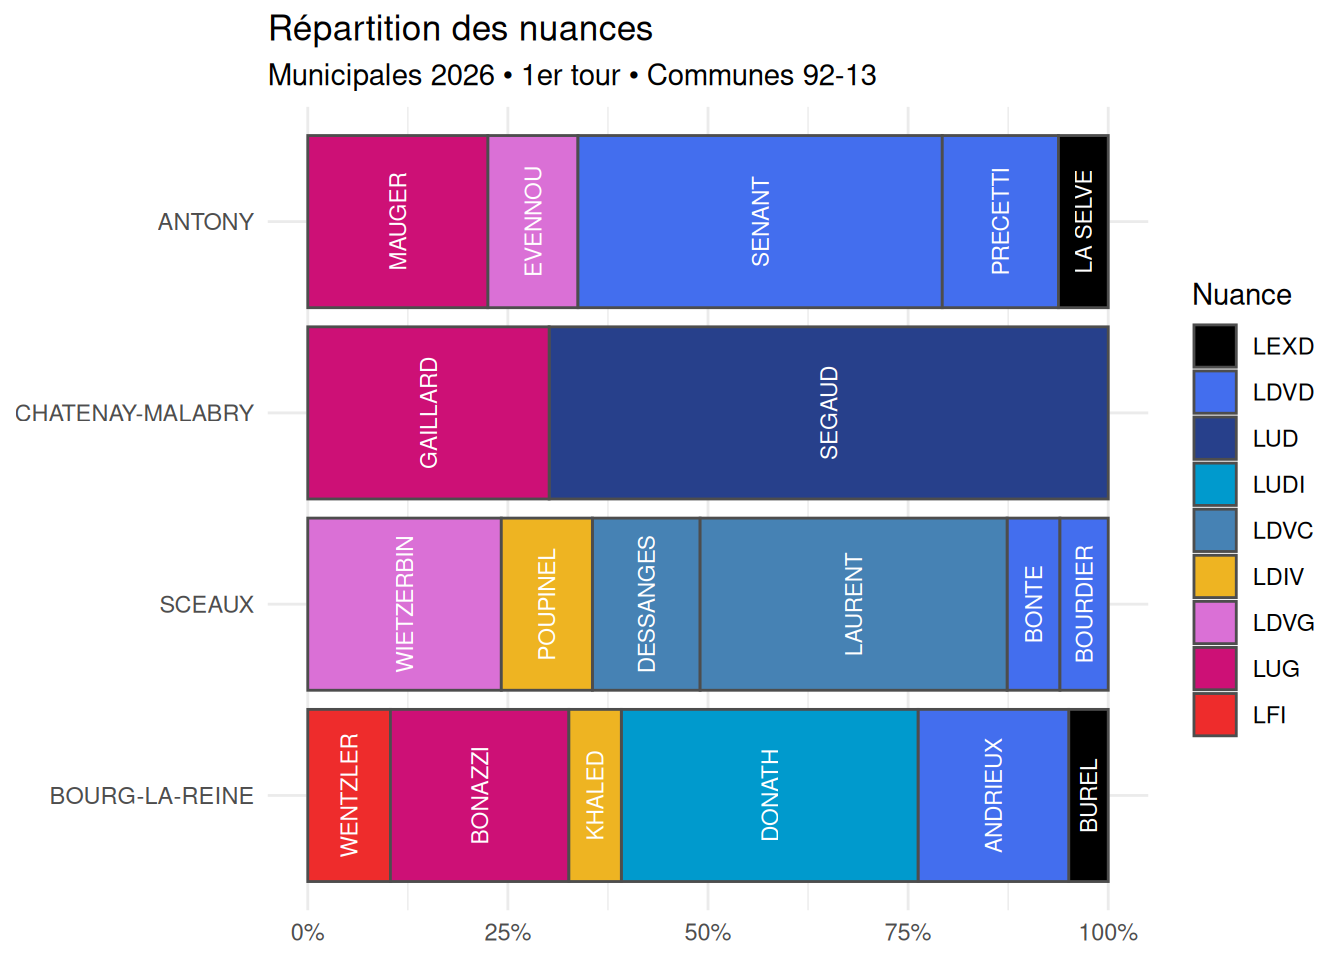
## Histogramme
```{r}
#| label: histo
p <- df_2026 |>
    summarise(
        voix = sum(voix, na.rm = TRUE),
        inscrits = sum(inscrits, na.rm = TRUE),
        exprimes = sum(exprimes, na.rm = TRUE),
        .by = c(commune, nom, code_nuance)
    ) |>
    ggplot(aes(x = reorder(commune, inscrits), y = voix, fill = code_nuance)) +
    coord_flip() +
    theme_minimal() +
    scale_fill_manual(values = palette_nuances) +
    labs(x = NULL, y = NULL, fill = "Nuance")

p +
    geom_col(color = "grey30") +
    geom_text(
        aes(label = nom),
        position = position_stack(vjust = 0.5),
        angle = 90,
        check_overlap = TRUE,
        color = "white",
        size = 3
    ) +
    labs(
        title = "Voix par nuance",
        subtitle = "Municipales 2026 • 1er tour • Communes 92-13"
    )
p +
    geom_col(position = "fill", color = "grey30") +
    geom_text(
        aes(label = nom),
        position = position_fill(vjust = 0.5),
        angle = 90,
        check_overlap = TRUE,
        color = "white",
        size = 3
    ) +
    scale_y_continuous(labels = scales::label_percent()) +
    labs(
        title = "Répartition des nuances",
        subtitle = "Municipales 2026 • 1er tour • Communes 92-13"
    )
```
## Carte
```{r}
#| label: map
library(leaflet)

sf_2026G <- df_2026 |>
    filter(nom %in% c("MAUGER", "GAILLARD", "WIETZERBIN", "BONAZZI")) |>
    mutate(
        score = voix / exprimes,
        codeBureauVote = glue::glue(
            "{code_insee}_{str_pad(code_bureau_vote, 4, pad = '0')}"
        )
    ) |>
    left_join(
        sig9213 |> select(codeBureauVote, geometry),
        by = "codeBureauVote"
    ) |>
    sf::st_as_sf()

pal <- colorNumeric(
    palette = "Reds",
    domain = sf_2026G$score,
    na.color = "transparent"
)

leaflet(sf_2026G) |>
    addProviderTiles(providers$CartoDB.Positron) |>
    addPolygons(
        fillColor = ~ pal(score),
        fillOpacity = 0.7,
        weight = 0.3,
        color = "white",
        opacity = 0.8,
        popup = ~ glue::glue(
            "<b>{commune}</b><br>{nom} : {scales::percent(score, accuracy = 0.01, decimal.mark = ',')}"
        )
    ) |>
    addControl(
        html = "Score des candidat·e·s soutenus par le PS<br>Municipales 2026 • 1er tour • Communes 92-13",
        position = "bottomleft"
    )
```
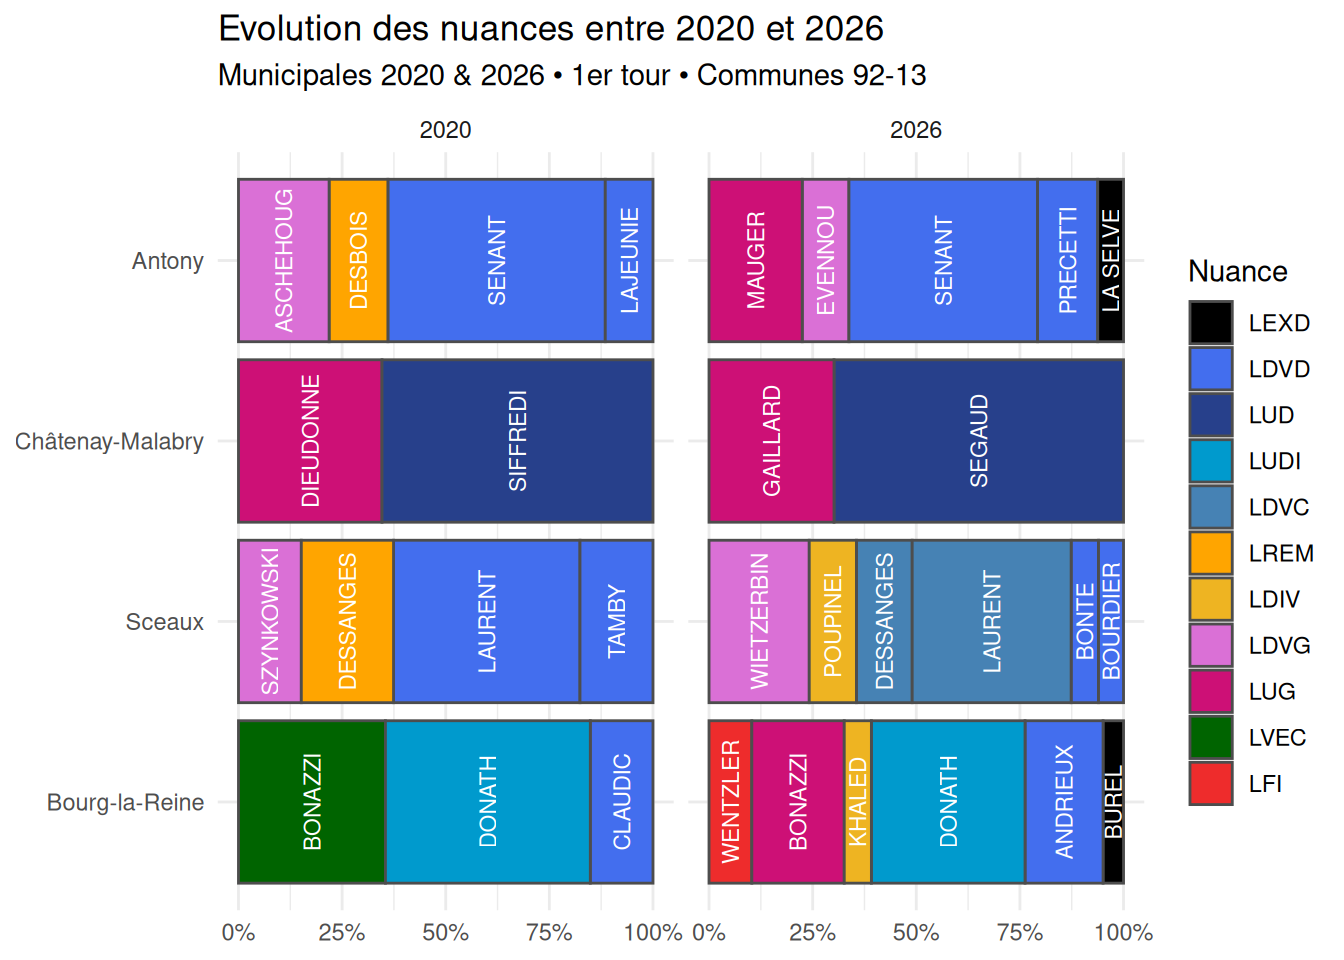
## Evolution 2020-2026
```{r}
#| label: evol
df_evol <- df |>
    filter(
        type == "Municipales",
        tour == "1",
        annee %in% c("2020", "2026"),
        code_insee %in% names(communes9213)
    ) |>
    mutate(
        code_nuance = factor(
            code_nuance,
            levels = names(palette_nuances)
        ),
        codeBureauVote = glue::glue(
            "{code_insee}_{str_pad(code_bureau_vote, 4, pad = '0')}"
        ),
        score = voix / exprimes,
    ) |>
    select(
        type,
        tour,
        annee,
        commune,
        code_insee,
        codeBureauVote,
        inscrits,
        exprimes,
        voix,
        score,
        nom,
        code_nuance
    )

df_evol |>
    summarise(
        voix = sum(voix, na.rm = TRUE),
        inscrits = sum(inscrits, na.rm = TRUE),
        exprimes = sum(exprimes, na.rm = TRUE),
        .by = c(code_insee, nom, code_nuance, annee)
    ) |>
    ggplot(aes(
        x = reorder(code_insee, inscrits),
        y = voix,
        fill = code_nuance
    )) +
    geom_col(position = "fill", color = "grey30") +
    geom_text(
        aes(label = nom),
        position = position_fill(vjust = 0.5),
        angle = 90,
        check_overlap = TRUE,
        color = "white",
        size = 3
    ) +
    coord_flip() +
    facet_wrap(~annee) +
    theme_minimal() +
    scale_fill_manual(values = palette_nuances) +
    labs(x = NULL, y = NULL, fill = "Nuance") +
    scale_x_discrete(labels = communes9213) +
    scale_y_continuous(labels = scales::label_percent()) +
    labs(
        title = "Evolution des nuances entre 2020 et 2026",
        subtitle = "Municipales 2020 & 2026 • 1er tour • Communes 92-13"
    )
nuances_NFP <- c("LDVG", "LUG", "LVEC", "LFI")

sf_evol_nfp <- df_evol |>
    select(-type, -tour, -code_insee) |>
    mutate(
        popup = glue::glue(
            "{annee} - {nom} : {scales::percent(score, accuracy = 0.01, decimal.mark = ',')}"
        )
    ) |>
    filter(code_nuance %in% nuances_NFP, annee %in% c("2020", "2026")) |>
    summarise(
        score_nfp = sum(score, na.rm = TRUE),
        popup = str_c(unique(popup), collapse = "<br>"),
        .by = c(codeBureauVote, annee)
    ) |>
    pivot_wider(
        names_from = annee,
        values_from = c(score_nfp, popup),
        names_sep = "_",
        values_fill = NA
    ) |>
    mutate(
        evolution_nfp = score_nfp_2026 - score_nfp_2020,
        popup = str_c(
            popup_2020,
            "<br>",
            popup_2026
        ),
        .keep = "unused"
    ) |>
    left_join(
        sig9213 |> select(codeBureauVote, geometry),
        by = "codeBureauVote"
    ) |>
    sf::st_as_sf()

palRG <- colorNumeric(
    palette = c("red", "white", "green"),
    domain = c(
        -max(abs(sf_evol_nfp$evolution_nfp), na.rm = TRUE),
        +max(abs(sf_evol_nfp$evolution_nfp), na.rm = TRUE)
    ),
    na.color = "transparent"
)

leaflet(sf_evol_nfp) |>
    addProviderTiles(providers$CartoDB.Positron) |>
    addPolygons(
        fillColor = ~ palRG(evolution_nfp),
        fillOpacity = 0.7,
        weight = 0.3,
        color = "white",
        opacity = 0.8,
        popup = ~ glue::glue(
            "<b>{codeBureauVote} ({ifelse(evolution_nfp>0, '+', '')}{scales::percent(evolution_nfp, accuracy = 0.01, decimal.mark = ',')})</b><br>{popup}"
        )
    ) |>
    addControl(
        html = "Evolution de la somme des candidat·e·s de gauche (LDVG, LUG, LVEC, LFI) <br>Municipales 2020-2026 • 1er tour • Communes 92-13",
        position = "bottomleft"
    ) |>
    addLegend(
        position = "bottomright",
        pal = palRG,
        values = c(
            -max(abs(sf_evol_nfp$evolution_nfp), na.rm = TRUE),
            +max(abs(sf_evol_nfp$evolution_nfp), na.rm = TRUE)
        ),
        title = "Évolution",
        labFormat = labelFormat(suffix = " pts")
    )
```